Monitoring Nutanix DR: Proactive Protection Health
Overview
Even the best-designed DR strategy only works if your replication is healthy, protection policies execute successfully, and recovery points are current. This post focuses on monitoring replication health, tracking protection policy status, and catching issues proactively using Prism Central dashboards, NCC health checks, and nCLI troubleshooting commands to ensure your DR capabilities are ready when disaster strikes.
📖 Disaster Recovery in 2025 Series - Part 9 This post is part of my comprehensive disaster recovery series. New to the series? Start with the Complete Guide Overview to see what's coming, or catch up with Part 1 - Why DR Matters, Part 2 - Modern Disaster Recovery, Part 3 - Nutanix DR Overview, Part 4 - Protection Policies, Part 5 - Recovery Plans, Part 6 - Testing DR, Part 7 - Planned vs. Unplanned Failover, and Part 8 - Guest Script Automation.
In the previous post on Guest Script Automation, I explored how to automate in-guest configurations during failover operations, eliminating manual intervention and reducing RTO. Across this series, I've tried to build a comprehensive DR strategy: from protection policies and recovery plans to testing and automation.
But here's another reality many organizations face: even the best-designed DR strategy only works if your replication is healthy, your protection policies are executing successfully, and your recovery points are current. You can have perfect Recovery Plans and brilliant automation scripts, but if replication has been failing for the past week and nobody noticed, your RTO becomes meaningless when disaster strikes.
This post focuses on the operational side of disaster recovery: monitoring replication health, tracking protection policy status, catching issues proactively, and ensuring that when you need your DR capabilities, they're ready to perform.
Why DR Monitoring Is Critical
The Silent Failure Scenario
Here's a scenario I've seen happen more than once: An organization has Nutanix DR configured, protection policies in place, and recovery plans tested successfully. Everything looks good. Then a disaster occurs, and when they attempt failover, they discover:
- The last successful replication was 5 days ago due to network connectivity issues nobody noticed
- Protection policy snapshots have been failing because the recovery site ran out of storage capacity
- A VM was removed from the category that drives the protection policy, and it hasn't been replicated in weeks
- The RPO they thought was 1 hour is actually "unknown" because replication hasn't completed successfully in days
These aren't hypothetical problems; they're real failures that happen when DR infrastructure isn't monitored properly. The disaster recovery solution is in place, but it's not actually protecting anything because nobody noticed it stopped working.
The Cost of Discovering Issues During Failover
Finding out your DR isn't working during an actual disaster event is the worst possible time to learn about infrastructure problems. By then:
- Your primary site is down, so you can't fix replication issues
- Your Recovery Point Objective has been missed, potentially by days
- Data loss is unavoidable because recent data never made it to the recovery site
- Your measured RTO includes all the time spent troubleshooting why failover isn't working
- Stakeholder confidence in the DR program is permanently damaged
Proactive monitoring catches these issues during normal operations when you can fix them without business impact.
What to Monitor in Nutanix DR
Protection Policy Replication Status
The most critical metric for any DR environment is whether replication is actually succeeding. You need to monitor:
Replication Completion Status
- Are snapshot replication jobs completing successfully?
- When did the last successful replication occur for each protection policy?
- Are there any policies showing failed or stalled replication?
- How long do replications take to complete (trend analysis for capacity planning)?
Recovery Point Age
- How old is the most recent recovery point at the DR site for each protected entity?
- Is the RPO being met based on your policy configuration?
- Are there VMs with recovery points older than expected?
Replication Lag
For Near-Sync and Synchronous replication:
- What's the current replication lag between sites?
- Are lag times trending upward (indicating potential capacity or network issues)?
- Are lag times within acceptable thresholds for your RPO requirements?
Storage Capacity at Recovery Sites
Replication consumes storage capacity at the recovery site, and running out of space causes immediate replication failures:
Capacity Metrics to Track
- Current storage utilization percentage at recovery clusters
- Rate of capacity consumption (trend analysis)
- Projected time until capacity exhaustion based on current trends
- Available capacity for new protection policies or VM additions
Snapshot Retention and Cleanup
- Are retention policies cleaning up old snapshots properly?
- Is snapshot accumulation outpacing deletion?
- Are there VMs with excessive snapshot counts consuming capacity?
Network Connectivity Between Sites
Replication depends on reliable network connectivity between primary and recovery sites:
Network Health Indicators
- Bandwidth utilization for replication traffic
- Network latency between sites
- Packet loss rates on replication links
- Network failures or interruptions
VM Protection Coverage
Just because you have protection policies doesn't mean all your critical VMs are actually protected:
Coverage Validation
- Which VMs are protected by policies vs. unprotected?
- Are there VMs that should be protected based on categories but aren't?
- Have VMs been removed from categories and lost protection inadvertently?
- Are newly deployed VMs being picked up by category-based protection?
Recovery Plan Validation
Recovery Plans need to stay current with your environment:
Recovery Plan Health
- Do Recovery Plans reference VMs that no longer exist?
- Are there protected VMs not included in any Recovery Plan?
- Have network mappings been validated recently?
- Are test failover schedules being executed on time?
Monitoring Approaches and Tools
Prism Central Built-In Monitoring
Prism Central provides native monitoring capabilities for DR operations:
Data Protection Dashboard
The Data Protection dashboard in Prism Central offers:
- Visual status of all protection policies
- Recent replication job status and history
- Alerts for failed or missed replication schedules
- Recovery point age for protected entities
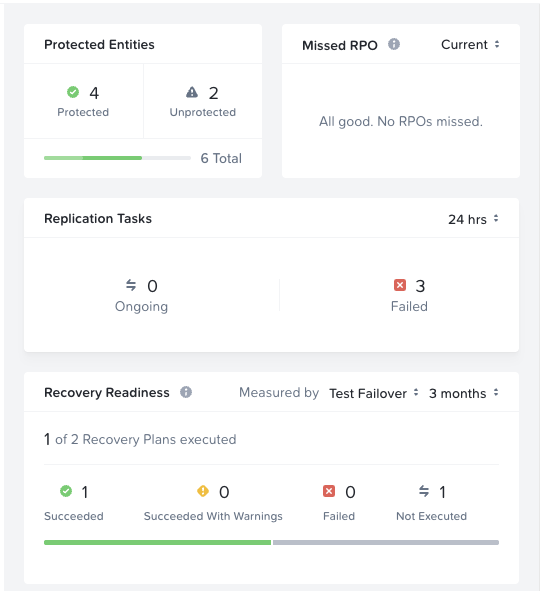
The dashboard above shows key metrics: 4 protected entities (with 2 unprotected that need attention), no missed RPOs, 3 failed replication tasks in the last 24 hours that require investigation, and recovery readiness showing 1 of 2 recovery plans have been tested.
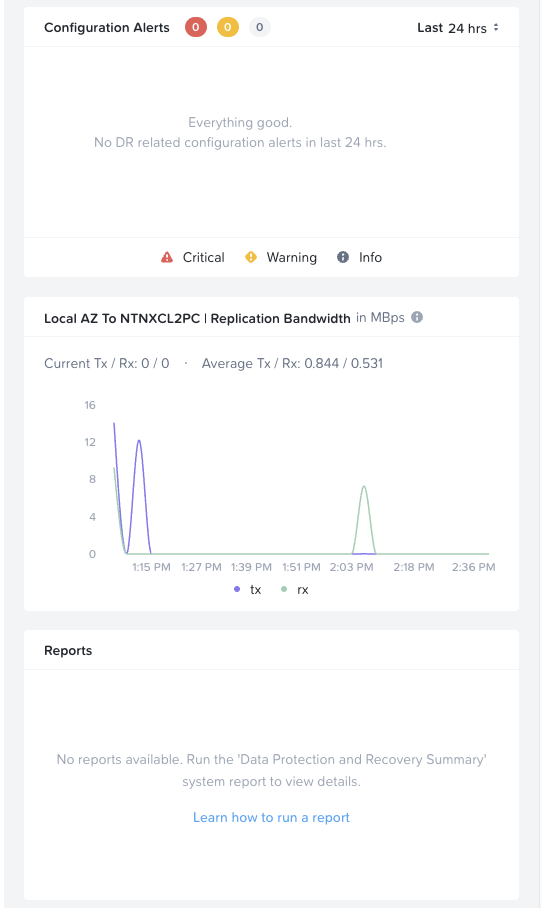
The configuration alerts and replication bandwidth widgets provide additional visibility. The bandwidth graph shows tx/rx traffic patterns between availability zones, helping identify throughput bottlenecks or unusual replication activity.
This dashboard should be reviewed daily by operations teams to catch issues quickly.
Alerts and Notifications
Configure alerts in Prism Central for:
- Protection policy replication failures
- Recovery point age exceeding thresholds
- Storage capacity warnings at recovery sites
- Network connectivity issues between availability zones
Alerts can be delivered via email, SNMP, or webhook integrations to monitoring platforms.
Nutanix Cluster Check (NCC) and Pulse
Beyond Prism Central dashboards, Nutanix provides two additional tools that are essential for comprehensive DR monitoring: NCC and Pulse.
Nutanix Cluster Check (NCC)
NCC is a diagnostic framework that runs health checks across your Nutanix infrastructure, including DR-related components. Key DR health checks include:
- Remote site connectivity: Validates network connectivity between primary and recovery clusters
- Replication status: Checks for stalled or failed replication jobs
- Protection domain health: Verifies protection domain configurations are valid
- Cerebro service health: Monitors the service responsible for data protection and replication
Run NCC checks manually from any CVM:
1ncc health_checks run_all
Or run specific DR-related checks:
1ncc health_checks data_protection_checks run_all
Schedule regular NCC runs (daily or weekly) and review the results as part of your DR monitoring routine. NCC can identify issues that may not surface in Prism Central alerts until they become critical.
Pulse
Pulse is Nutanix's proactive support feature that automatically sends cluster health and configuration data to Nutanix Support. When enabled, Pulse provides:
- Proactive issue detection: Nutanix Support can identify potential DR issues before they impact operations
- Faster case resolution: Support engineers have immediate access to cluster diagnostics when you open a case
- Health scoring: Pulse data feeds into Nutanix's health scoring algorithms that can flag at-risk configurations
Ensure Pulse is enabled on all clusters participating in DR. When DR issues arise, having Pulse data available significantly accelerates troubleshooting with Nutanix Support.
To verify Pulse status:
1ncli pulse-config ls
Best Practice: Enable Pulse and schedule regular NCC health checks on both primary and recovery clusters. These tools provide visibility into infrastructure health that complements application-level DR monitoring.
API-Based Monitoring Integration
For organizations with existing monitoring platforms (Prometheus, Grafana, Datadog, etc.), Nutanix provides comprehensive APIs via Prism Central for extracting DR metrics. Key data points available through the API include:
- Protection policy status and last execution times
- VM protection coverage
- Recovery point details and age
- Replication job history and outcomes
- Storage capacity at recovery clusters
These APIs enable integration with enterprise monitoring platforms for centralized visibility alongside other infrastructure metrics. Refer to the Nutanix Prism Central API documentation for endpoint details and authentication requirements.
Troubleshooting Commands from the CVM
When issues arise, the Nutanix Command Line Interface (nCLI) on the Controller VM provides powerful troubleshooting commands. For entity-centric protection (used by Prism Central-managed DR), you must specify protection-domain-type=entity-centric or remote-site-type=entity-centric to see the relevant information.
Important: Even though Nutanix DR is configured and managed through Prism Central, the nCLI troubleshooting commands covered in this section are run from a Controller VM (CVM) on the cluster, not from the Prism Central VM. This is a common point of confusion since Prism Central is a key requirement for Nutanix DR, unlike legacy Protection Domains which are local to each cluster. SSH into any CVM in your cluster to run these commands.
Verifying Availability Zone Connectivity
To check the relationship status with remote sites (availability zones):
1ncli remote-site list remote-site-type=entity-centric
Example output showing a healthy relationship:
 1    Name                      : remote_172_20_120_254_00063773-6b04-fd01-0000-000000013fed
 2    Uuid                      : 00063773-6b04-fd01-0000-000000013fed
 3    Capabilities              : disaster_recovery
 4    Replication Bandwidth     : -
 5    SSH Tunnel Enabled        : false
 6    Remote Address(es)        : 172.20.120.33:2020, 172.20.120.32:2020, 172.20.120.34:2020, 172.20.120.31:2020
 7    Vstore Map                :
 8    Proxy Enabled             :
 9    Compression               : on
10    Bandwidth Policy          : disabled
11    Health Status             :
12    Status                    : relationship established
The critical field here is Status. You want to see relationship established. If the status shows anything else (such as disconnected or degraded), investigate network connectivity between the sites immediately.
Other useful fields:
- Remote Address(es): Lists all CVM IPs at the remote site used for replication
- Compression: Whether data compression is enabled for replication traffic
- Capabilities: Confirms the site is configured for disaster recovery
Checking Current Replication Activity
To see any active replication operations:
1ncli pd ls-repl-status protection-domain-type=entity-centric
Example output showing active replications:
 1    Id                        : 26287
 2    Protection Domain         : pd_1764353265009855_42
 3    Replication Operation     : Sending
 4    Start Time                : 11/28/2025 19:07:47 UTC
 5    Remote Site               : remote_172_20_20_254_00064459-7adb-daa2-0d8c-00be7572ee3e
 6    Snapshot Id               : 26243
 7    Aborted                   : false
 8    Paused                    : false
 9    Bytes Completed           : 1.22 GiB (1,305,307,723 bytes)
10    Complete Percent          : 100.0
11
12    Id                        : 26289
13    Protection Domain         : pd_1764353265013917_43
14    Replication Operation     : Sending
15    Start Time                : 11/28/2025 19:07:47 UTC
16    Remote Site               : remote_172_20_20_254_00064459-7adb-daa2-0d8c-00be7572ee3e
17    Snapshot Id               : 26240
18    Aborted                   : false
19    Paused                    : false
20    Bytes Completed           : 0 bytes
21    Complete Percent          : 0.0
Key fields to check:
- Replication Operation: Shows whether sending or receiving data
- Aborted/Paused: Indicates if replication was stopped unexpectedly
- Complete Percent: Shows progress of active replications
- Bytes Completed: Useful for gauging throughput and estimating completion time
Pausing and Resuming Replication
There are scenarios where you may need to temporarily pause replication—for example, during bandwidth constraints, performance issues, or planned maintenance windows. Pausing replication queues all scheduled replications until you resume.
First, identify the Protection Domain name and Replication ID using the status commands above. For legacy Protection Domain replication:
1ncli pd ls-repl-status
For Nutanix DR (entity-centric) replication:
1ncli pd ls-repl-status protection-domain-type=entity-centric
Once you have the Protection Domain name and Replication ID, pause the replication:
1ncli pd pause-repl name=<protection_domain_name> replication-ids=<replication_ID>
Note: When you pause replication, the local replication to the target is paused and all scheduled replications are queued. Once resumed, both the paused replication and any queued replications will continue.
When ready to resume replication:
1ncli pd resume-repl name=<protection_domain_name> replication-ids=<replication_ID>
Important considerations when pausing replication:
- Monitor how long replication remains paused, remember extended pauses impact your RPO
- Queued replications will compete for bandwidth when resumed, potentially causing a temporary spike
- Document the reason for pausing in your change management system
- Set a reminder to resume replication if pausing for a maintenance window
For detailed information on pausing, resuming, and cancelling replication operations, see Nutanix KB-3754.
Bandwidth and Change Rate Considerations
One of the most common issues I see impacting replication success and RPO/RTO targets is insufficient bandwidth to replicate the required data. Before troubleshooting replication failures, it's worth understanding the relationship between your available bandwidth and your VM change rate.
Your replication bandwidth must be sufficient to transfer all changed data within your RPO window. For example, if your VMs generate 100 GB of changes per hour and your RPO is 1 hour, you need enough bandwidth to transfer 100 GB in less than 60 minutes. If your link can only sustain 50 GB/hour of throughput, you'll never meet that RPO regardless of how well everything else is configured.
Key factors to evaluate:
- VM change rate: How much data changes between replication cycles? Database servers, file servers, and applications with heavy write activity will have higher change rates than static web servers.
- Available bandwidth: What's the actual usable bandwidth between sites after accounting for other traffic? A 1 Gbps link shared with production traffic won't deliver 1 Gbps for replication.
- Replication window: For scheduled replication, how long does the replication have to complete before the next cycle starts?
- Compression effectiveness: Nutanix compresses replication traffic, but compression ratios vary based on data type. Already-compressed data (media files, encrypted data) won't compress further.
If you're consistently missing RPO targets, the first troubleshooting step should be validating that your bandwidth can physically support your change rate requirements.
Bandwidth Throttling Limitations
While legacy Protection Domains provided an easy way to apply bandwidth limitations via nCLI, Nutanix Disaster Recovery (entity-centric) does not support this through the command line. Attempting to use the traditional bandwidth scheduling command fails:
1ncli remote-site add-bandwidth-schedule remote-site-name=remote_172_20_120_254_00063773-6b04-fd01-0000-000000013fed default-bandwidth=100
1Error: Do not use NCLI based bandwidth limiting for Nutanix Disaster Recovery
2(formerly Leap), this may cause future replication to fail. To enable bandwidth
3throttling for Nutanix Disaster Recovery (formerly Leap), please contact
4Nutanix Support.
5
6Aborting operation.
If you need to apply bandwidth limits on replication with Nutanix DR, contact Nutanix Support for assistance with the proper configuration method.
Building a DR Monitoring Strategy
Define Monitoring Thresholds
Establish clear thresholds that trigger alerts:
Example Thresholds
- Recovery Point Age: Alert if > 2x the expected RPO (e.g., if RPO is 4 hours, alert if recovery point is > 8 hours old)
- Replication Failures: Alert on any failed replication job
- Storage Capacity: Alert at 75% utilization, critical alert at 85%
- Network Lag: Alert if replication lag exceeds 2x the normal baseline
Thresholds should align with your business requirements and provide early warning before issues impact recovery capability.
Monitoring Cadence and Responsibilities
Establish who monitors what, and how often:
Daily Monitoring
- Review Data Protection dashboard for policy status
- Validate no critical alerts or failures
- Spot-check recovery point ages for critical workloads
Weekly Review
- Analyze replication performance trends
- Review storage capacity projections
- Validate VM protection coverage against inventory
- Check that test failover schedules are being executed
Monthly Validation
- Comprehensive review of all protection policies
- Recovery Plan validation against current environment
- Capacity planning for DR infrastructure
- Documentation updates based on configuration changes
Integration with Incident Response
DR monitoring should integrate with your incident response processes:
Alert Escalation
- Tier 1: Email alerts to operations team for review during business hours
- Tier 2: Page on-call engineer for critical failures outside business hours
- Tier 3: Escalate to management if issues aren't resolved within SLA timeframes
Runbooks for Common Failures
Document remediation procedures for common monitoring alerts:
- How to investigate replication failures
- Steps to resolve storage capacity issues
- Process for re-adding VMs to protection policies
- Escalation paths when issues can't be resolved quickly
Proactive vs. Reactive DR Operations
The difference between proactive and reactive DR operations is dramatic:
Reactive Approach (Don't Do This)
- Assume DR is working unless someone reports a problem
- Discover replication failures during failover attempts
- Only review DR infrastructure during annual audits
- Find out about capacity issues when replication starts failing
Proactive Approach (The Right Way)
- Monitor replication status continuously
- Catch failures within hours, not days or weeks
- Validate DR health as part of routine operations
- Identify and resolve capacity issues before they impact replication
- Regularly test failover capabilities to validate readiness
Organizations with proactive monitoring have dramatically higher success rates during actual disaster events because their DR infrastructure is continuously validated and issues are caught early.
Wrapping Up: From Reactive to Proactive DR
Monitoring transforms disaster recovery from a "hope it works" approach to a confident, validated capability. While Protection Policies and Recovery Plans define what should happen during failover, monitoring ensures those systems are actually functioning day-to-day.
The key principle we explored is simple but critical: You can't recover what you haven't replicated. Proactive monitoring catches replication failures, capacity issues, and connectivity problems before they impact your ability to recover from an actual disaster.
What We Covered
Throughout this post, we've explored:
- Why DR monitoring is critical: Understanding the silent failure scenario where DR infrastructure stops working without anyone noticing
- What to monitor: Replication status, recovery point age, storage capacity, network connectivity, and VM protection coverage
- Monitoring approaches: Prism Central dashboards, NCC health checks, Pulse, and API integration options
- Troubleshooting commands: nCLI commands for checking replication activity, availability zone connectivity, and managing replication operations
- Operational considerations: Pausing/resuming replication and bandwidth throttling limitations
- Building a monitoring strategy: Defining thresholds, establishing cadence, and integrating with incident response
Key Takeaways
Monitor continuously: DR infrastructure that isn't monitored is DR infrastructure that can fail silently. Daily dashboard reviews should be standard practice.
Define clear thresholds: Alert when recovery point age exceeds 2x your RPO, when storage hits 75% capacity, or when replication jobs fail.
Use the right tools for the job: For entity-centric (Nutanix DR) protection, always specify
protection-domain-type=entity-centricorremote-site-type=entity-centricin your nCLI commands.Integrate with operations: DR monitoring alerts should flow into your existing incident response processes with clear escalation paths.
Document and validate: Maintain runbooks for common failures and regularly validate that your monitoring catches the issues you expect it to catch.
Next Steps
As you implement DR monitoring in your environment:
- Review current state: Run
ncli pd ls-repl-status protection-domain-type=entity-centricandncli remote-site list remote-site-type=entity-centricto understand your current replication status - Configure alerts: Set up Prism Central alerts for replication failures and capacity thresholds
- Establish daily reviews: Add Data Protection dashboard review to your daily operations checklist
- Create runbooks: Document remediation procedures for common monitoring alerts
- Test your monitoring: Intentionally pause a replication and verify your alerts fire as expected
- Integrate with existing tools: If you have enterprise monitoring platforms, explore API integration for centralized visibility
Effective DR monitoring isn't about adding complexity. It's about gaining confidence that your disaster recovery capabilities will perform when you need them most.
Have questions about monitoring your Nutanix DR environment? Feel free to reach out to me at mike@mikedent.io.
Thanks for reading!
What's Next: Series Conclusion
This post concludes the technical deep-dives in the Nutanix Disaster Recovery series. We've covered everything from fundamental DR concepts through protection policies, recovery plans, testing, failover execution, automation, and monitoring.
In the series conclusion, we'll tie everything together, recap the key takeaways, and discuss how to build a comprehensive DR program that combines all these elements into a cohesive business continuity strategy.
Your disaster recovery infrastructure is only as good as your confidence that it works when you need it. Monitoring ensures that confidence is earned, not assumed.